Market Outlook
February 09, 2018
Market Cues
Domestic Indices
Chg (%)
(Pts)
(Close)
Indian markets are likely to open negative tracking global indices and SGX Nifty.
BSE Sensex
1.0
330
34,413
US stocks were hammered yet again as markets quickly tanked after an initial move
Nifty
1.0
100
10,577
higher after amid lingering anxiety over potential interest rate hikes. The Dow Jones
Mid Cap
1.8
298
16,649
ended on downside front of 4.1% to close at 23,860 and the Nasdaq Composite
Small Cap
2.3
400
18,131
edged down to 3.9%, to 6,777.
Bankex
1.1
324
29,396
U.K. shares fell on last trading session as investors exercised some caution after
sharp gains in the previous session and looked ahead to the Bank of England's
Global Indices
Chg (%)
(Pts)
(Close)
monetary policy decision for directional cues. The FTSE 100 was down by 1.5% to
Dow Jones
(4.1)
(1,033)
23,860
close at 7,171.
Nasdaq
(3.9)
(275)
6,777
On domestic front, Indian shares opened modestly higher after oil prices fell
FTSE
(1.5)
(109)
7,171
2.5 percent to close at a one-month closing low the previous day, helping ease
Nikkei
(3.2)
(705)
21,186
investor concerns surrounding inflation and rising twin deficits. The Sensex ended on
Hang Seng
(4.2)
(1,283)
29,169
an upside front of 1.0% at 34,413 while the Nifty ended at 10,577 with an upside of
Shanghai Com
(4.6)
(151)
3,112
1.0%.
News Analysis
Advances / Declines
BSE
NSE
Galaxy Surfactants Limited - Booking profit with upside of 15%
Advances
2,206
1,497
Declines
636
301
Detailed analysis on Pg2
Unchanged
109
52
Investor’s Ready Reckoner
Key Domestic & Global Indicators
Volumes (` Cr)
Stock Watch: Latest investment recommendations on 150+ stocks
BSE
5,558
Refer Pg5 onwards
NSE
34,882
Top Picks
CMP
Target
Upside
Net Inflows (` Cr)
Net
Mtd
Ytd
Company
Sector
Rating
(`)
(`)
(%)
FII
(1,001)
(1,347)
11,637
Blue Star
Capital Goods
Buy
725
867
19.6
Dewan Housing Finance
Financials
Buy
513
712
38.7
*MFs
473
1,423
10,446
Asian Granito
Other
Buy
515
651
26.4
Navkar Corporation
Other
Buy
172
265
54.4
Top Gainers
Price (`)
Chg (%)
KEI Industries
Capital Goods Accumulate
388
436
12.3
Hfcl
28
10.7
More Top Picks on Pg4
Den
113
8.8
Key Upcoming Events
Ghcl
312
8.5
Previous
Consensus
Date
Region
Event Description
Cipla
614
7.8
Reading
Expectations
Feb09
UK
BOE Announces rates
0.50
0.50
Bharatforg
761
7.7
Feb09
China
Consumer Price Index (YoY)
1.80
1.50
Feb12
Euro Zone Euro-Zone GDP s.a. (QoQ)
0.60
Top Losers
Price (`)
Chg (%)
Feb13
India
Industrial Production YoY
8.40
Hexaware
337
(5.0)
Feb14
UK
CPI (YoY)
3.00
3.00
More Events on Pg7
Vakrangee
192
(5.0)
Swanenergy
196
(4.5)
Jubilant
968
(3.8)
Uflex
379
(3.6)
As on February 08 2018
Market Outlook
February 09, 2018
News Analysis
Galaxy Surfactants Limited - Booking profit with upside of 15%
We had recommended SUBSCRIBE rating for Galaxy Surfactants Limited IPO
which successfully raised `937cr at `1480. At yesterday’s closing price, it is trading
at 15% premium on IPO price. We recommend to book profit in Galaxy
Surfactants Limited at the Current price.
Economic and Political News
India's refining capacity to rise 77% by 2030; RIL's to expand 44%
Govt mulls comprehensive policy for refined pure gold export
India's renewable energy project tendering to be an all-time high in FY18
Government considering tax benefits for scrapping 15-year old vehicles
Corporate News
Dr Reddy's recalls 80k bottles of Atorvastatin from US over quality issue
Amazon takes on Flipkart's Myntra, to launch in-house personal care labels
AirAsia likely to reconfirm order for Airbus A330neo jets
Bharat Forge to invest Rs 300mn for 45% stake in EV startup TORK Motors
Market Outlook
February 09, 2018
Quarterly Bloomberg Brokers Consensus Estimate
Tata Steel Ltd - Feb 09, 2018
Particulars ( ` cr)
3QFY18E
3QFY17
y-o-y (%)
2QFY18
q-o-q (%)
Sales
32,526
27,589
17.9
32,464
0.2
EBIDTA
5,163
3,566
44.8
4,676
10.4
%
15.8
12.9
14.4
PAT
1,401
231
506.5
1,017
37.8
M&M Ltd. - Feb 09, 2018
Particulars ( ` cr)
3QFY18E
3QFY17
y-o-y (%)
2QFY18
q-o-q (%)
Sales
11,722
11,010
6.5
12,182
(3.8)
EBIDTA
1,421
1,299
9.4
1,729
(17.9)
%
12.2
11.8
14.2
PAT
850
1,112
(23.6)
1,331
(36.2)
ONGC Ltd. - Feb 09, 2018
Particulars ( ` cr)
3QFY18E
3QFY17
y-o-y (%)
2QFY18
q-o-q (%)
Sales
25,206
20,013
25.9
18,964
32.9
EBIDTA
12,599
9,005
39.9
9,136
37.9
%
49.9
45
48.2
PAT
6,051
4,352
39.1
5,130
17.9
BPCL Ltd. - Feb 09, 2018
Particulars ( ` cr)
3QFY18E
3QFY17
y-o-y (%)
2QFY18
q-o-q (%)
Sales
52,490
53,542
(1.9)
53,325
(1.6)
EBIDTA
2,894
3,316
(12.7)
3,527
(17.9)
%
5.5
6.2
6.6
PAT
2,043
2,271
(10.1)
2,357
(13.3)
Marico Ltd. - Feb 09, 2018
Particulars ( ` cr)
3QFY18E
3QFY17
y-o-y (%)
2QFY18
q-o-q (%)
Sales
1,608
1,416
13.5
1,536
4.6
EBIDTA
290
272
6.6
258
12.4
%
18.1
19.2
16.8
PAT
205
191
7.3
185
10.8
SBI Ltd. - Feb 09, 2018
Particulars ( ` cr)
3QFY18E
3QFY17
y-o-y (%)
2QFY18
q-o-q (%)
PAT
3,953
2,152
83.6
1,840
114.8
BOB Ltd. - Feb 09, 2018
Particulars ( ` cr)
3QFY18E
3QFY17
y-o-y (%)
2QFY18
q-o-q (%)
PAT
339
252
34.5
355
(4.5)
Market Outlook
February 09, 2018
Top Picks
Market Cap
CMP
Target
Upside
Company
Rationale
(` Cr)
(`)
(`)
(%)
Strong growth in domestic business due to its leade`hip
in acute therapeutic segment. Alkem expects to launch
Alkem Laboratories
25,970
2,172
2,441
12.4
more products in USA, which bodes for its international
business.
We expect the company would report strong profitability
Asian Granito
1,549
515
651
26.4
owing to better product mix, higher B2C sales and
amalgamation synergy.
Favorable outlook for the AC industry to augur well for
Cooling products business which is out pacing the
Blue Star
6,953
725
867
19.6
market growth. EMPPAC division's profitability to
improve once operating environment turns around.
With a focus on the low and medium income (LMI)
consumer segment, the company has increased its
Dewan Housing Finance
16,103
513
712
38.7
presence in tier-II & III cities where the growth
opportunity is immense.
Loan growth is likely to pick up after a sluggish FY17.
Lower credit cost will help in strong bottom-line growth.
Karur Vysya Bank
8,217
113
160
41.5
Increasing share of CASA will help in NIM
improvement.
High order book execution in EPC segment, rising B2C
KEI Industries
3,043
388
436
12.3
sales and higher exports to boost the revenues and
profitability
Expected to benefit from the lower capex requirement
Music Broadcast
2,061
361
475
31.5
and 15 year long radio broadcast licensing.
Massive capacity expansion along with rail advantage
Navkar Corporation
2,584
172
265
54.4
at ICD as well CFS augur well for the company
Strong brands and distribution network would boost
Siyaram Silk Mills
3,153
673
851
26.5
growth going ahead. Stock currently trades at an
inexpensive valuation.
Market leadership in Hindi news genre and no.
2
viewership ranking in English news genre, exit from the
TV Today Network
2,725
457
500
9.5
radio business, and anticipated growth in ad spends by
corporate to benefit the stock.
After GST, the company is expected to see higher
volumes along with improving product mix. The Gujarat
Maruti Suzuki
2,72,689
9,027
10,619
17.6
plant will also enable higher operating leverage which
will be margin accretive.
We expect loan book to grow at 24.3% over next two
GIC Housing
2,189
407
655
61.1
year; change in borrowing mix will help in NIM
improvement
We expect CPIL to report net Revenue/PAT CAGR of
~17%/16% over FY2017-20E mainly due to healthy
7,256
327
400
22.5
growth in plywood & lamination business, forayed into
Century Plyboards India
MDF & Particle boards on back of strong brand &
distribution network.
We expect sales/PAT to grow at 13.5%/20% over next
LT Foods
2,952
92
128
38.7
two years on the back of strong distribution network &
addition of new products in portfolio.
We expect sales/PAT to grow at 13%/16% over next two
years on the back of strong healthy demand in writing
Ruchira Papers
401
179
244
36.4
& printing paper and Kraft paper. Further, China had
banned making paper from waste pulp which would
benefit Indian paper companies.
We expect financialisation of savings and increasing
Aditya Birla Capital
36942
168
230
36.9
penetration in Insurance & Mutual fund would ensure
steady growth.
Source: Company, Angel Research
Market Outlook
February 09, 2018
Fundamental Call
Market Cap
CMP
Target
Upside
Company
Rationale
(` Cr)
(`)
(`)
(%)
CCL is likely to maintain the strong growth trajectory
CCL Products
3,973
299
360
20.5
over FY18-20 backed by capacity expansion and new
geographical foray
We forecast Nilkamal to report top-line CAGR of ~9%
to `2,635cr over FY17-20E on the back of healthy
Nilkamal
2,610
1,749
2,178
24.5
demand growth in plastic division. On the bottom-line
front, we estimate ~10% CAGR to `162cr owing to
improvement in volumes.
We expect sales/PAT to grow at 9%/14% over next two
years on the back of healthy demand growth in
Shreyans Industries
252
182
247
35.5
printing. Further, China had banned making paper
from waste pulp which would benefit Indian paper
companies.
The prism has diversified exposure in the different
segment such as Cement, Tile & ready mix concrete.
Prism Cement
6,730
134
160
19.7
Thus we believe, PCL is in the right place to capture
ongoing government spending on affordable housing
and infrastructure projects.
Source: Company, Angel Research
Market Outlook
February 09, 2018
Key Upcoming Events
Result Calendar
Date
Company
February 09, 2018
Suzlon Energy, India Cements, Bank of Baroda, Central Bank, UCO Bank, Marico, Sun TV Network, Tata Steel
February 10, 2018
Amara Raja Batteries, Mangalam Cement, Coal India, Sarda Energy, PTC India
Source: Bloomberg, Angel Research
Global economic events release calendar
Bloomberg Data
Date
Time
Country
Event Description
Unit
Period
Last Reported
Estimated
Feb 09, 2018
5:30 PMUK
BOE Announces rates
% Ratio
Feb 8
0.50
0.50
3:00 PMUK
Industrial Production (YoY)
% Change
Dec
2.50
0.30
Feb 12, 2018
5:30 PMIndia
Industrial Production YoY
% Change
Dec
8.40
Feb 13, 2018
3:00 PMUK
CPI (YoY)
% Change
Jan
3.00
Feb 14, 2018
3:30 PMEuro Zone Euro-Zone GDP s.a. (QoQ)
% Change
4Q P
0.60
12:00 PMIndia
Monthly Wholesale Prices YoY%
% Change
Jan
3.58
7:00 PMUS
Consumer price index (mom)
% Change
Jan
0.10
0.30
12:30 PMGermany GDP nsa (YoY)
% Change
4Q P
2.30
Feb 15, 2018
7:45 PMUS
Industrial Production
%
Jan
0.89
0.30
India
Imports YoY%
% Change
Jan
21.10
India
Exports YoY%
% Change
Jan
12.40
7:00 PMUS
Housing Starts
Thousands
Jan
1,192.00
1,225.00
Feb 16, 2018
US
Producer Price Index (mom)
% Change
Jan
(0.30)
7:00 PMUS
Building permits
Thousands
Jan
1,300.00
1,300.00
Feb 20, 2018
8:30 PMEuro Zone Euro-Zone Consumer Confidence
Value
Feb A
1.30
Source: Bloomberg, Angel Research
Market Outlook
February 09, 2018
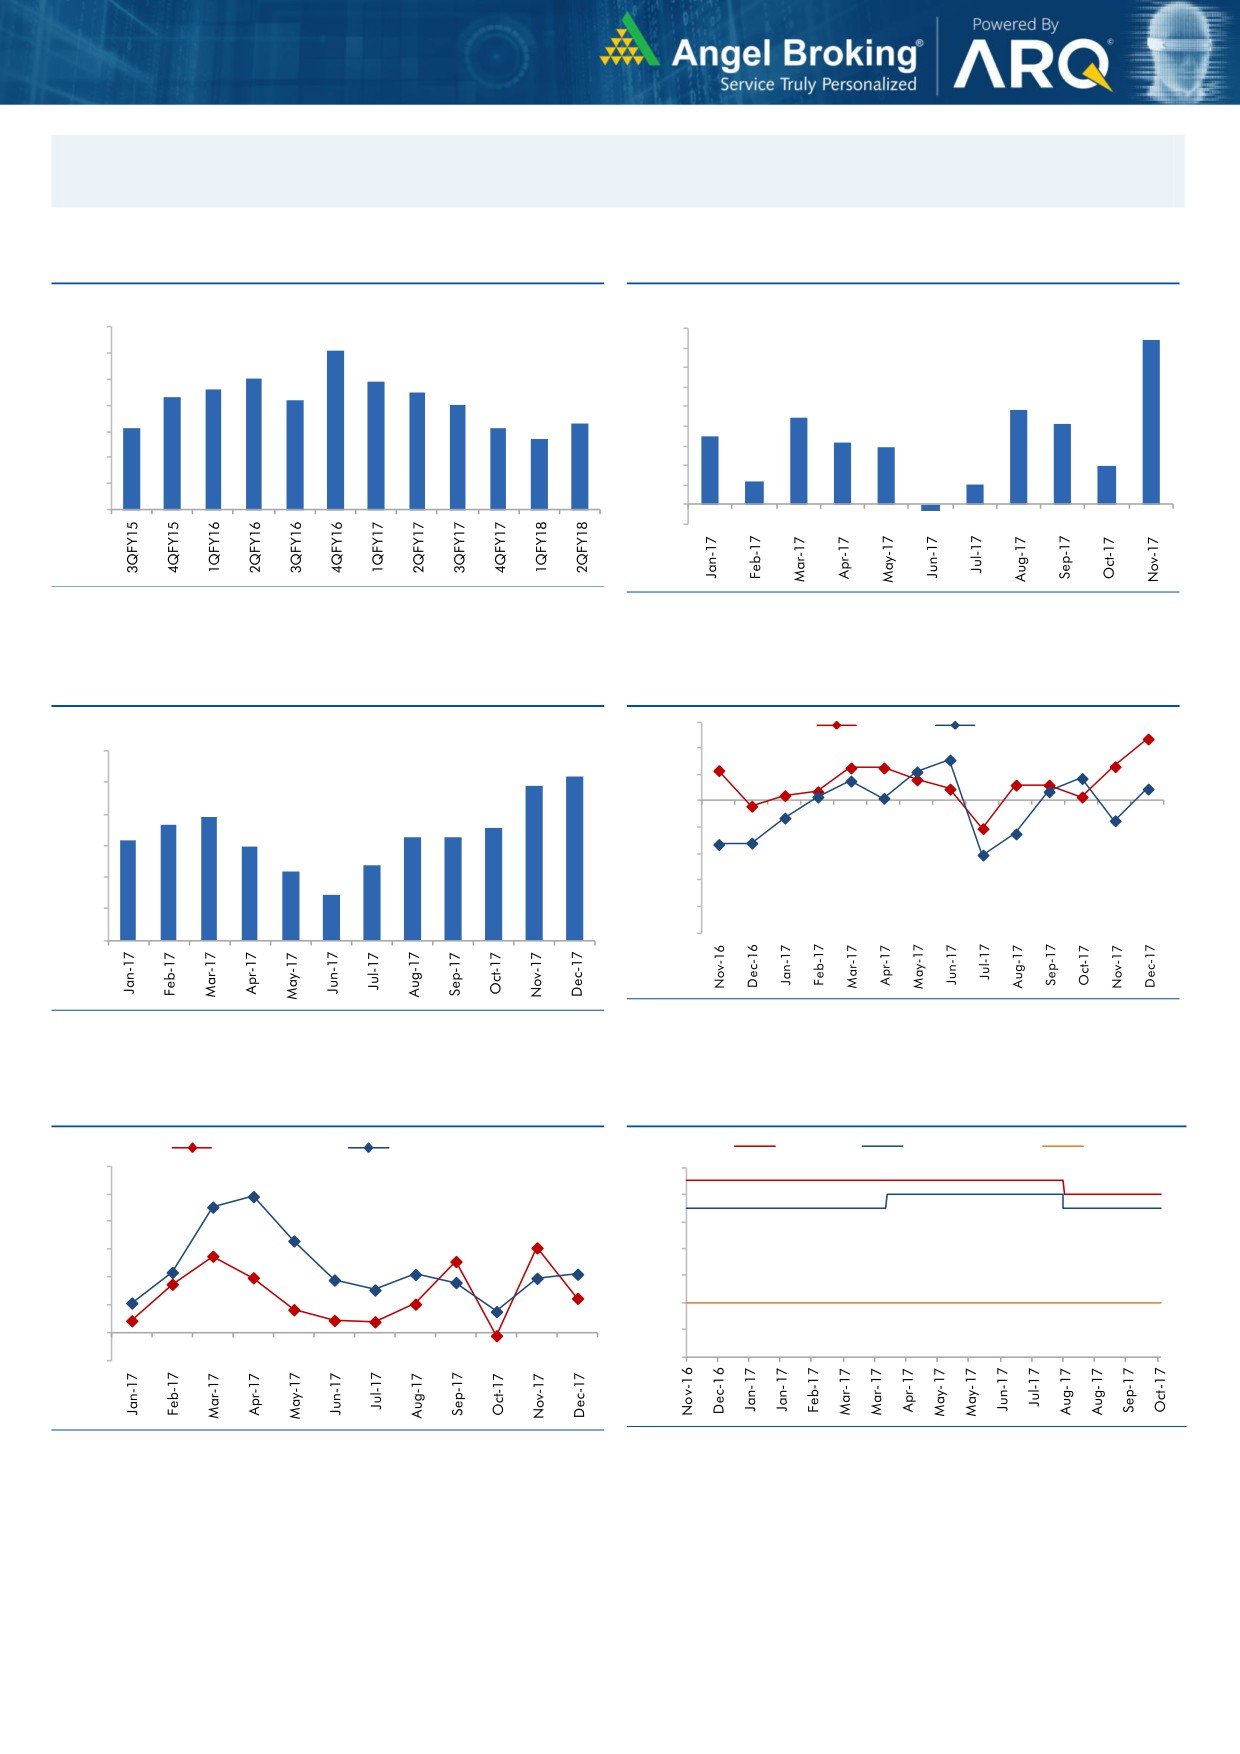
Macro watch
Exhibit 1: Quarterly GDP trends
Exhibit 2: IIP trends
(%)
(%)
10.0
9.0
8.4
9.1
9.0
8.0
8.0
7.9
7.0
7.6
7.5
8.0
7.3
7.2
7.0
6.0
4.8
7.0
6.3
5.0
4.4
4.1
6.1
6.1
5.7
3.5
3.2
6.0
4.0
2.9
3.0
2.0
5.0
2.0
1.2
1.0
4.0
1.0
-
3.0
(1.0)
(0.3)
Source: CSO, Angel Research
Source: MOSPI, Angel Research
Exhibit 3: Monthly CPI inflation trends
Exhibit 4: Manufacturing and services PMI
56.0
Mfg. PMI
Services PMI
(%)
6.0
54.0
5.2
4.9
52.0
5.0
3.9
50.0
3.7
3.6
4.0
3.3
3.3
3.2
3.0
48.0
3.0
2.4
2.2
46.0
2.0
1.5
44.0
1.0
42.0
40.0
-
Source: Market, Angel Research; Note: Level above 50 indicates expansion
Source: MOSPI, Angel Research
Exhibit 5: Exports and imports growth trends
Exhibit 6: Key policy rates
(%)
Exports yoy growth
Imports yoy growth
(%)
Repo rate
Reverse Repo rate
CRR
60.0
6.50
50.0
6.00
40.0
5.50
30.0
5.00
20.0
4.50
10.0
4.00
0.0
3.50
(10.0)
3.00
Source: Bloomberg, Angel Research
Source: RBI, Angel Research
Market Outlook
February 09, 2018
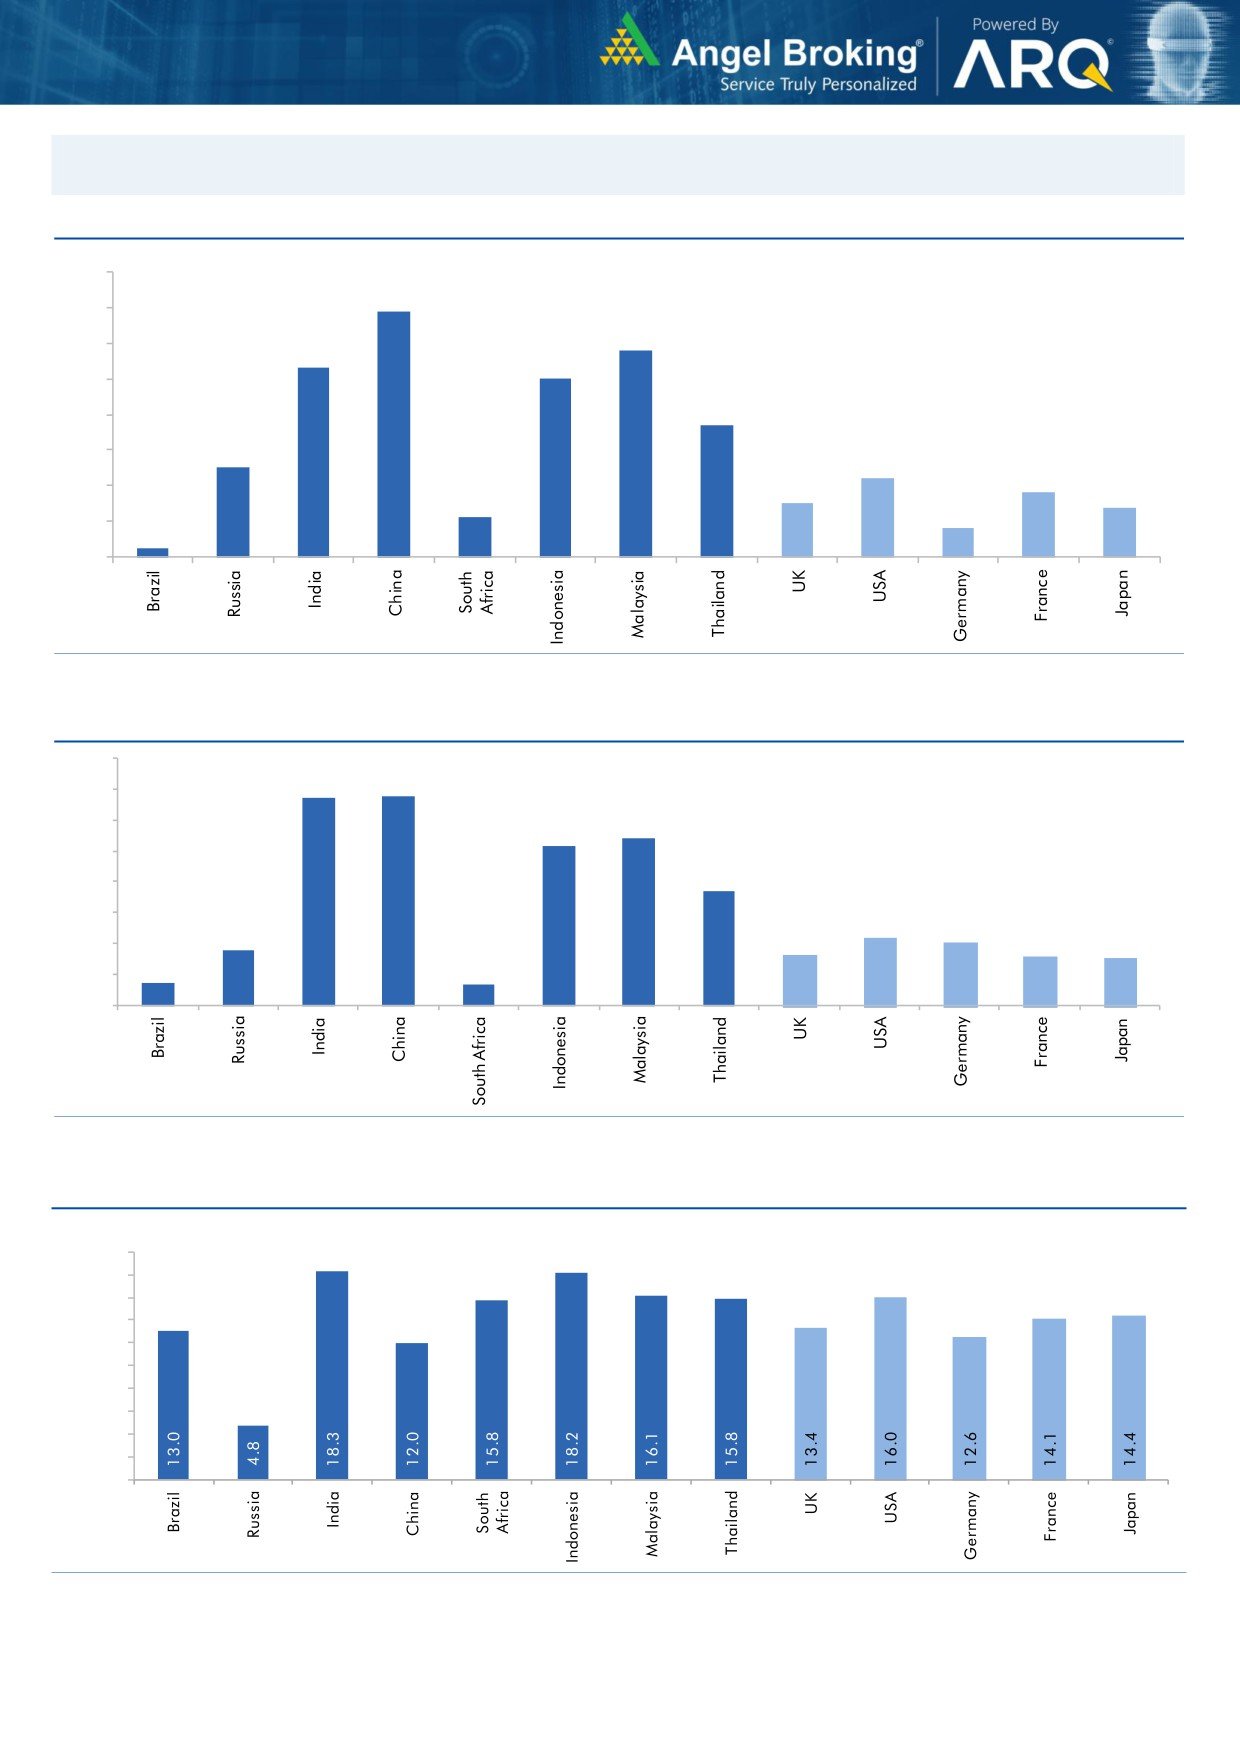
Global watch
Exhibit 1: Latest quarterly GDP Growth (%, yoy) across select developing and developed countries
(%)
8.0
6.9
7.0
5.8
6.0
5.3
5.0
5.0
1.1
3.7
4.0
2.5
3.0
2.2
1.8
2.0
1.5
1.4
0.8
1.0
0.3
-
Source: Bloomberg, Angel Research
Exhibit 2: 2017 GDP Growth projection by IMF (%, yoy) across select developing and developed countries
(%)
6.7
6.8
7.0
6.0
5.4
5.2
5.0
3.7
4.0
3.0
1.8
2.2
2.0
1.7
1.6
2.0
0.7
1.5
0.7
1.0
-
Source: IMF, Angel Research
Exhibit 3: One year forward P-E ratio across select developing and developed countries
(x)
20.0
18.0
16.0
14.0
12.0
10.0
8.0
6.0
4.0
2.0
-
Source: IMF, Angel Research
Market Outlook
February 09, 2018
Exhibit 4: Relative performance of indices across globe
Returns (%)
Country
Name of index
Closing price
1M
3M
1YR
Brazil
Bovespa
81,533
2.7
10.4
25.8
Russia
Micex
2,227
0.1
3.3
1.7
India
Nifty
10,577
(0.4)
2.7
20.2
China
Shanghai Composite
3,262
(9.0)
(9.3)
(1.6)
South Africa
Top 40
49,935
(6.1)
(7.2)
10.1
Mexico
Mexbol
47,862
(4.3)
(1.4)
2.0
Indonesia
LQ45
1,103
1.2
8.4
23.8
Malaysia
KLCI
1,839
1.2
5.7
9.1
Thailand
SET 50
1,157
(0.8)
6.5
17.6
USA
Dow Jones
23,860
(5.6)
1.3
18.3
UK
FTSE
7,171
(7.2)
(4.6)
(1.2)
Japan
Nikkei
21,891
(8.2)
(2.9)
15.7
Germany
DAX
12,260
(8.4)
(8.4)
5.3
France
CAC
5,152
(6.7)
(6.0)
5.2
Source: Bloomberg, Angel Research p68in4
Market Outlook
February 09, 2018
Research Team Tel: 022 - 39357800
DISCLAIMER
Angel Broking Private Limited (hereinafter referred to as “Angel”) is a registered Member of National Stock Exchange of India
Limited,Bombay Stock Exchange Limited and Metropolitan Stock Exchange Limited. It is also registered as a Depository Participant with
CDSL and Portfolio Manager with SEBI. It also has registration with AMFI as a Mutual Fund Distributor. Angel Broking Private Limited is a
registered entity with SEBI for Research Analyst in terms of SEBI (Research Analyst) Regulations, 2014 vide registration number
INH000000164. Angel or its associates has not been debarred/ suspended by SEBI or any other regulatory authority for accessing
/dealing in securities Market. Angel or its associates/analyst has not received any compensation / managed or
co-managed public offering of securities of the company covered by Analyst during the past twelve months.
This document is solely for the personal information of the recipient, and must not be singularly used as the basis of any investment
decision. Nothing in this document should be construed as investment or financial advice. Each recipient of this document should make
such investigations as they deem necessary to arrive at an independent evaluation of an investment in the securities of the companies
referred to in this document (including the merits and risks involved), and should consult their own advisors to determine the merits and
risks of such an investment.
Reports based on technical and derivative analysis center on studying charts of a stock's price movement, outstanding positions and
trading volume, as opposed to focusing on a company's fundamentals and, as such, may not match with a report on a company's
fundamentals. Investors are advised to refer the Fundamental and Technical Research Reports available on our website to evaluate the
contrary view, if any.
The information in this document has been printed on the basis of publicly available information, internal data and other reliable
sources believed to be true, but we do not represent that it is accurate or complete and it should not be relied on as such, as this
document is for general guidance only. Angel Broking Pvt. Limited or any of its affiliates/ group companies shall not be in any way
responsible for any loss or damage that may arise to any person from any inadvertent error in the information contained in this report.
Angel Broking Pvt. Limited has not independently verified all the information contained within this document. Accordingly, we cannot
testify, nor make any representation or warranty, express or implied, to the accuracy, contents or data contained within this document.
While Angel Broking Pvt. Limited endeavors to update on a reasonable basis the information discussed in this material, there may be
regulatory, compliance, or other reasons that prevent us from doing so.
This document is being supplied to you solely for your information, and its contents, information or data may not be reproduced,
redistributed or passed on, directly or indirectly.
Neither Angel Broking Pvt. Limited, nor its directors, employees or affiliates shall be liable for any loss or damage that may arise from
or in connection with the use of this information.